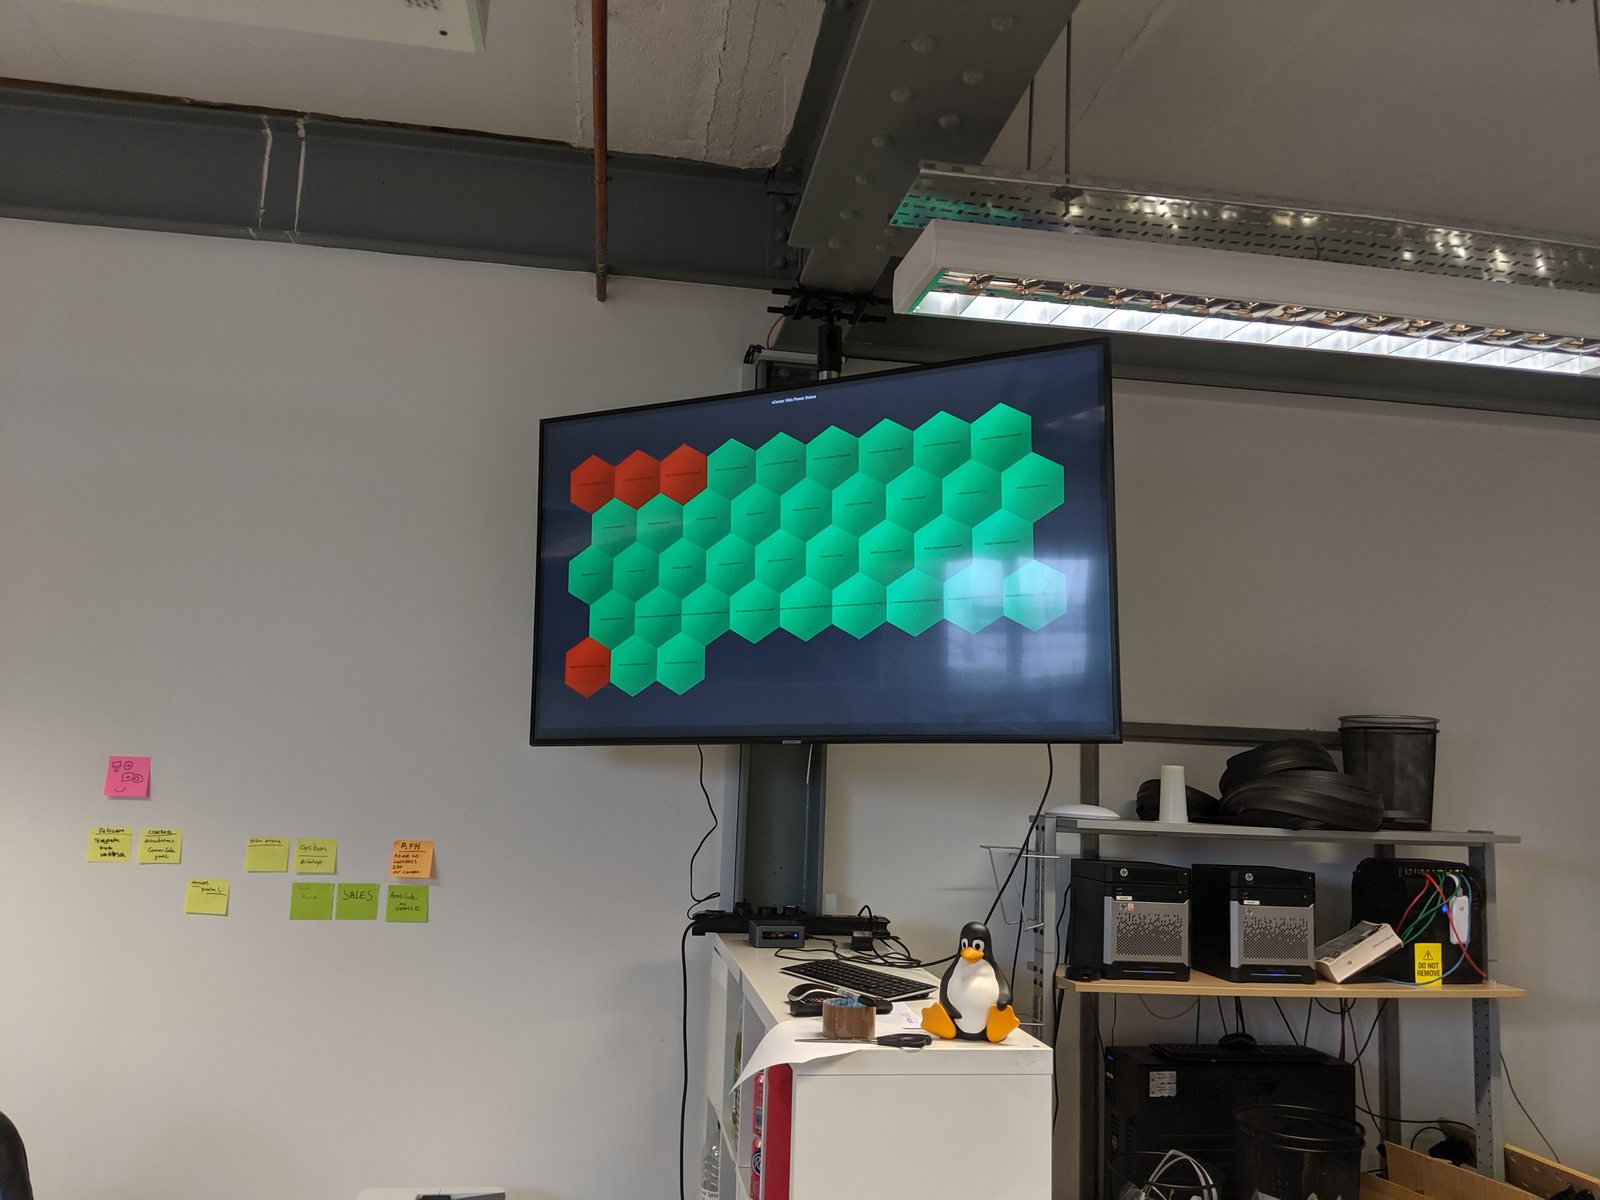
There is now a screen on the wall. It has the gauges, the sparklines and the green panels, and when a client walks past it they ask what it costs to get one.
The screen is the cheapest part. Everything that makes it worth having sits behind it, and almost none of that is a purchasing decision.
What the stack actually is
The components are unexciting, and chosen for it. Prometheus scrapes metrics and holds them short-term. Exporters sit next to the things being measured and speak Prometheus's language on their behalf. Loki takes logs, indexed by label rather than by content, so a query starts from "which service, which host" instead of a full-text search across everything. Grafana puts a face on all of it.
One piece of that list is a bet: Loki only reached 1.0 this month, and we treat it accordingly. The rest has been boring for years. Every piece is open, every piece runs on our own hardware, and if we stopped paying anyone tomorrow it would keep running. That mattered more to us than any feature comparison, because a monitoring system you can lose access to is a monitoring system that fails at the worst moment.
The architecture is a pipeline and it is worth stating plainly, because the diagrams people draw of this are usually more complicated than the thing:
- applications and infrastructure expose metrics, exporters scrape them, Prometheus stores them
- logs ship to Loki and are found by label
- Grafana queries both and draws
- rules evaluate in Prometheus; routing and silencing happen somewhere else
That last line is where the difficulty lives.
The part that took the year
Deciding what is allowed to wake somebody up.
An alert is a claim that a human needs to act, now, and almost every default alert that ships with anything fails that test. Disk at eighty per cent is not an emergency; disk filling at a rate that reaches full before office hours is. CPU at ninety per cent is a fact, not a problem. A failed backup job matters enormously and almost never pages anyone, because nobody wrote the rule.
What we ended up with is a short list of questions each rule has to answer, and rules that cannot answer them do not get to page:
- What has stopped working for a user? Not what metric moved.
- What will the person who is woken actually do? If the answer is "look at it and go back to bed", it is a dashboard panel, not a page.
- How do we know this is still true in ten minutes? An alert that fires on one scrape of one instance is noise waiting to happen.
- Who silences it, and for how long, during planned work? A system with no answer to this teaches people to ignore it, which is worse than no alerts.
None of that is a product feature. It is a conversation per service, and the conversation is slow because the honest answer to "should this wake someone" is often "no" and somebody has to say so.
Running it rather than handing it over
The thing that is new for us is that we operate this, instead of building it and leaving it with a client. That changes the design in ways we did not anticipate.
Every alert has an owner who is not the author. If we are the ones woken, we are also the ones who reject a rule that pages without a cause. That turns out to be the only reliable filter anyone has found.
Dashboards decay and nobody notices. A panel that silently stopped reporting looks identical to a panel reporting that everything is fine. We now treat a dashboard the same as any other deployed artefact: it is in version control, and the thing that renders it is rebuilt rather than edited in place.
Retention is a decision, not a default. Metrics kept forever at full resolution get expensive quickly, and nobody looks at per-second data from eighteen months ago. Short-term fine-grained, long-term coarse and the boundary chosen on purpose.
What we would tell anyone standing one up
The stack is a fortnight. Budget for the rest.
Instrument the things a user would notice first, not the things easiest to measure. Host metrics are easy and tell you least; a synthetic check that logs in the way a customer does is harder and tells you most.
Write the runbook before the alert. If the rule fires at three in the morning and the person on call has to work out what it means from the alert text alone, the rule is unfinished.
And accept that most of this is organisational. The technology settled years ago. What has not settled, anywhere we have seen, is the discipline of deciding what deserves a human.